
Page 61 - Industrial Plants
P. 61
attracted to each other by improving the dust removal.
The block diagram of a closed-loop WES configuration
is shown in Figure 2 where a partial (>95%) recirculation
of the liquid is included and additional water and purge
streams are included to preserve system functioning
and optimise particles capture performance.
Figure 2 refers to the horizontal crossflow unit, that is
currently adopted by Boldrocchi, but the WES can be
designed using other configurations to optimise space
occupancy and system performances for different
industrial conditions.
The electrified spray (ES) allows the generation of
droplets having a defined surface electric charge. The
droplets charge also take place at medium electric
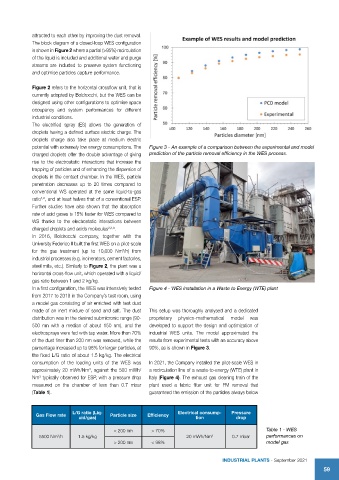
potential with extremely low energy consumptions. The Figure 3 - An example of a comparison between the experimental and model
charged droplets offer the double advantage of giving prediction of the particle removal efficiency in the WES process.
rise to the electrostatic interactions that increase the
trapping of particles and of enhancing the dispersion of
droplets in the contact chamber. In the WES, particle
penetration decreases up to 20 times compared to
conventional WS operated at the same liquid-to-gas
ratio , and at least halves that of a conventional ESP.
1,2
Further studies have also shown that the absorption
rate of acid gases is 15% faster for WES compared to
WS thanks to the electrostatic interactions between
charged droplets and acids molecules 2,3,4 .
In 2016, Boldrocchi company, together with the
University Federico II built the first WES on a pilot-scale
3
for the gas treatment (up to 10,000 Nm /h) from
industrial processes (e.g. incinerators, cement factories,
steel mills, etc.). Similarly to Figure 2, the plant was a
horizontal cross-flow unit, which operated with a liquid/
gas ratio between 1 and 2 kg/kg.
In a first configuration, the WES was intensively tested Figure 4 - WES installation in a Waste to Energy (WTE) plant
from 2017 to 2019 in the Company’s test room, using
a model gas consisting of air enriched with test dust
made of an inert mixture of sand and salt. The dust This setup was thoroughly analysed and a dedicated
distribution was in the desired submicronic range (90- proprietary physico-mathematical model was
500 nm with a median of about 150 nm), and the developed to support the design and optimization of
electrosprays were fed with tap water. More than 70% industrial WES units. The model approximated the
of the dust finer than 200 nm was removed, while the results from experimental tests with an accuracy above
percentage increased up to 98% for larger particles, at 90%, as is shown in Figure 3.
the fixed L/G ratio of about 1.5 kg/kg. The electrical
consumption of the loading units of the WES was In 2021, the Company installed the pilot-scale WES in
approximately 20 mWh/Nm , against the 500 mWh/ a recirculation line of a waste-to-energy (WTE) plant in
3
Nm typically observed for ESP, with a pressure drop Italy (Figure 4). The exhaust gas cleaning train of the
3
measured on the chamber of less than 0.7 mbar plant used a fabric filter unit for PM removal that
(Table 1). guaranteed the emission of the particles always below
L/G ratio (Liq- Electrical consump- Pressure
Gas Flow rate uid/gas) Particle size Efficiency tion drop
< 200 nm > 70% Table 1 - WES
5500 Nm /h 1.5 kg/kg 20 mWh/Nm 3 0.7 mbar performances on
3
> 200 nm < 98% model gas
IndustrIal Plants - September 2021
59