
Page 36 - Industrial Plants
P. 36
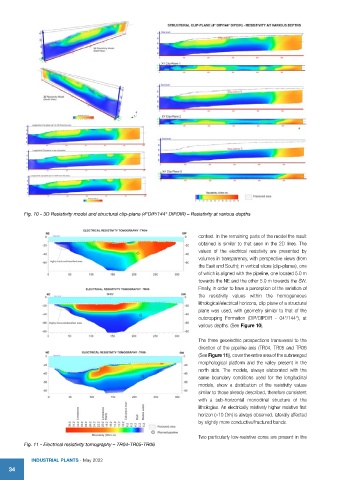
Fig. 10 - 3D Resistivity model and structural clip-plane (4°DIP/144° DIPDIR) – Resistivity at various depths


                                                                       context. In the remaining parts of the model the result
                                                                       obtained is similar to that seen in the 2D lines. The
                                                                       values of the electrical resistivity are presented by
                                                                       volumes in transparency, with perspective views (from
                                                                       the East and South); in vertical slices (clip-planes), one
                                                                       of which is aligned with the pipeline, one located 5.0 m
                                                                       towards the NE and the other 5.0 m towards the SW.
                                                                       Finally, in order to have a perception of the variation of
                                                                       the resistivity values within the homogeneous
                                                                       lithological/electrical horizons, clip plane of a structural
                                                                       plane was used, with geometry similar to that of the
                                                                       outcropping  Formation  (DIP/DIPDIR  -  04°/144°),  at
                                                                       various depths. (See Figure 10).

                                                                       The three geoelectric prospections transversal to the
                                                                       direction of the pipeline axis (TR04, TR05 and TR06
                                                                       (See Figure 11)), cover the entire area of the submerged
                                                                       morphological platform and the valley present in the
                                                                       north side. The models, always elaborated with the
                                                                       same boundary conditions used for the longitudinal
                                                                       models, show a distribution of the resistivity values
                                                                       similar to those already described, therefore consistent
                                                                       with  a  sub-horizontal  monoclinal  structure  of  the
                                                                       lithologies. An electrically relatively higher resistive first
                                                                       horizon (>10 Ωm) is always observed, laterally affected
                                                                       by slightly more conductive/fractured bands.

                                                                       Two particularly low-resistive cores are present in the
          Fig. 11 - Electrical resistivity tomography – TR04-TR05-TR06

            IndustrIal Plants - May 2022
    34