
Page 35 - Industrial Plants
P. 35
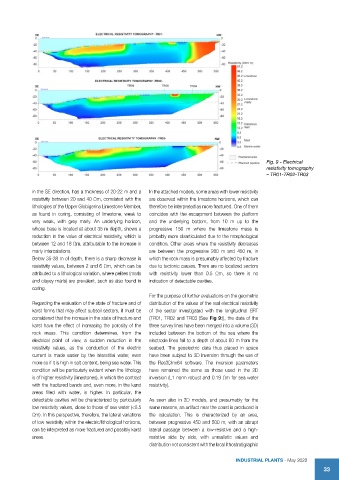
Fig. 9 - Electrical
                                                                                               resistivity tomography
                                                                                               – TR01-TR02-TR03

            in the SE direction, has a thickness of 20-22 m and a   In the attached models, some areas with lower resistivity
            resistivity between 20 and 40 Ωm, correlated with the   are observed within the limestone horizons, which can
            lithologies of the Upper Globigerina Limestone Member,   therefore be interpreted as more fractured. One of them
            as found in coring, consisting of limestone, weak to   coincides with the escarpment between the platform
            very weak, with grey marly. An underlying horizon,   and  the  underlying  bottom,  from  10  m  up  to  the
            whose base is located at about 35 m depth, shows a   progressive 150 m where the limestone mass is
            reduction in the value of electrical resistivity, which is   probably more disarticulated due to the morphological
            between 12 and 18 Ωm, attributable to the increase in   condition. Other areas where the resistivity decreases
            marly intercalations.                    are between the progressive 260 m and 450 m, in
            Below 35-38 m of depth, there is a sharp decrease in   which the rock mass is presumably affected by fracture
            resistivity values, between 2 and 6 Ωm, which can be   due to tectonic causes. There are no localized sectors
            attributed to a lithological variation, where pelites (marls   with resistivity lower than 0.5 Ωm, so there is no
            and clayey marls) are prevalent, such as also found in   indication of detectable cavities.
            coring.
                                                     For the purpose of further evaluations on the geometric
            Regarding the evaluation of the state of fracture and of   distribution of the values of the real electrical resistivity
            karst forms that may affect subsoil sectors, it must be   of the sector investigated with the longitudinal ERT
            considered that the increase in the state of fracture and   (TR01, TR02 and TR03 (See Fig 9:)), the data of the
            karst have the effect of increasing the porosity of the   three survey lines have been merged into a volume (3D)
            rock mass. This condition determines, from the   included between the bottom of the sea where the
            electrical point  of  view,  a sudden  reduction  in  the   electrode lines fall to a depth of about 60 m from the
            resistivity values, as the conduction of the electric   seabed. The geoelectric data thus placed in space
            current is made easier by the interstitial water, even   have been subject to 3D inversion through the use of
            more so if it is high in salt content, being sea water. This   the  Res3DInv64  software.  The  inversion  parameters
            condition will be particularly evident when the lithology   have remained the same as those used in the 2D
            is of higher resistivity (limestones), in which the contrast   inversion (L1 norm robust and 0.19 Ωm for sea water
            with the fractured bands and, even more, in the karst   resistivity).
            areas filled with water, is higher. In particular, the
            detectable cavities will be characterized by particularly   As seen also in 2D models, and presumably for the
            low resistivity values, close to those of sea water (<0.5   same reasons, an artifact near the coast is produced in
            Ωm). In this perspective, therefore, the lateral variations   the  calculation.  This  is  characterized  by  an  area,
            of low resistivity within the electric/lithological horizons,   between progressive 450 and 500 m, with an abrupt
            can be interpreted as more fractured and possibly karst   lateral passage between a low-resistive and a high-
            areas.                                   resistive side by side, with unrealistic values and
                                                     distribution not consistent with the local lithostratigraphic

                                                                                    IndustrIal Plants - May 2022
                                                                                                                   33