
Page 34 - Industrial Plants
P. 34
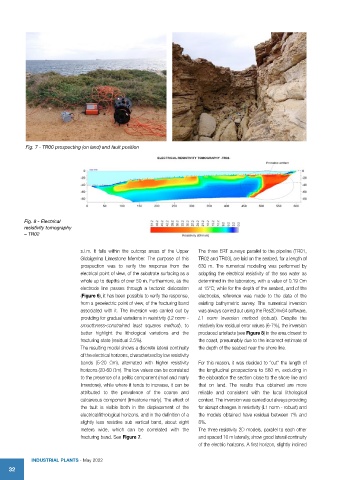
Fig. 7 - TR00 prospecting (on land) and fault position


          Fig. 8 - Electrical
          resistivity tomography
          – TR02

                             s.l.m.  It  falls  within  the  outcrop  areas  of  the  Upper   The three ERT surveys parallel to the pipeline (TR01,
                             Globigerina Limestone Member. The purpose of this   TR02 and TR03), are laid on the seabed, for a length of
                             prospection was to verify the response from the   630 m. The numerical modelling was performed by
                             electrical point of view, of the substrate surfacing as a   adopting the electrical resistivity of the sea water as
                             whole up to depths of over 50 m. Furthermore, as the   determined in the laboratory, with a value of 0.19 Ωm
                             electrode line passes through a tectonic dislocation   at 15°C; while for the depth of the seabed, and of the
                             (Figure 6), it has been possible to verify the response,   electrodes, reference was made to the data of the
                             from a geoelectric point of view, of the fracturing band   existing bathymetric survey. The numerical inversion
                             associated with it. The inversion was carried out by   was always carried out using the Res2DInv64 software,
                             providing for gradual variations in resistivity (L2 norm -   L1 norm inversion method (robust). Despite the
                             smoothness-constrained least squares method), to   relatively low residual error values (6-7%), the inversion
                             better  highlight  the  lithological  variations  and  the   produced artefacts (see Figure 8) in the area closest to
                             fracturing state (residual 2.5%).         the coast, presumably due to the incorrect estimate of
                             The resulting model shows a discrete lateral continuity   the depth of the seabed near the shore line.
                             of the electrical horizons, characterized by low resistivity
                             bands  (5-20 Ωm), alternated with  higher  resistivity   For this reason, it was decided to “cut” the length of
                             horizons (20-60 Ωm). The low values can be correlated   the longitudinal prospections to 560 m, excluding in
                             to the presence of a pelitic component (marl and marly   the elaboration the section close to the shore line and
                             limestone), while where it tends to increase, it can be   that on land. The results thus obtained are more
                             attributed to the prevalence of the coarse and   reliable and consistent with the local lithological
                             calcareous component (limestone marly). The effect of   context. The inversion was carried out always providing
                             the fault is visible both in the displacement of the   for abrupt changes in resistivity (L1 norm - robust) and
                             electrical/lithological horizons, and in the definition of a   the models obtained have residual between 7% and
                             slightly less resistive sub vertical band, about eight   8%.
                             meters  wide, which can  be  correlated  with  the   The three resistivity 2D models, parallel to each other
                             fracturing band. See Figure 7.            and spaced 10 m laterally, show good lateral continuity
                                                                       of the electric horizons. A first horizon, slightly inclined

            IndustrIal Plants - May 2022
    32