
Page 21 - Impiantistica Industriale
P. 21
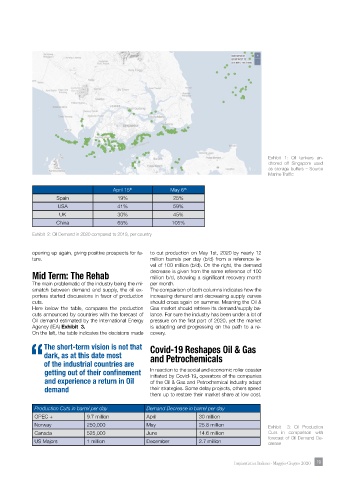
Exhibit 1: Oil tankers an-
                                                                                               chored off Singapore used
                                                                                               as storage buffers – Source
                                                                                               Marine Traffi c

                                         April 15 th         May 6 th
                     Spain                19%                 25%
                     USA                  41%                 59%
                      UK                  30%                 45%
                     China                65%                105%

            Exhibit  2: Oil Demand in 2020 compared to 2019, per country


            opening up again, giving positive prospects for fu-  to cut production on May 1st, 2020 by nearly 12
            ture.                                     million barrels per day (b/d) from a reference le-
                                                      vel of 100 million (b/d). On the right, the demand
            Mid Term: The Rehab                       decrease is given from the same reference of 100
                                                      million b/d, showing a signifi cant recovery month
            The main problematic of the industry being the mi-  per month.
            smatch between demand and supply, the oil ex-  The comparison of both columns indicates how the
            porters started discussions in favor of production   increasing demand and decreasing supply curves
            cuts.                                     should cross again on summer. Meaning the Oil &
            Here below the table, compares the production   Gas market should retrieve its demand/supply ba-
            cuts announced by countries with the forecast of   lance. For sure the industry has been under a lot of
            Oil demand estimated by the International Energy   pressure on the fi rst part of 2020, yet the market
            Agency (IEA) Exhibit  3.                  is adapting and progressing on the path to a re-
            On the left, the table indicates the decisions made   covery.

                 The short-term vision is not that    Covid-19 Reshapes Oil & Gas
                 dark, as at this date most           and Petrochemicals
            “of the industrial countries are

                 getting out of their confinement      In reaction to the social and economic roller coaster
                                                      initiated by Covid-19, operators of the companies
                 and experience a return in Oil       of the Oil & Gas and Petrochemical industry adapt
                 demand                               their strategies. Some delay projects, others speed
                                                      them up to restore their market share at low cost.

             Production Cuts in barrel per day      Demand Decrease in barrel per day
             OPEC +             9.7 million         April              30 million
             Norway             250,000             May                25.8 million            Exhibit  3: Oil Production
             Canada             525,000             June               14.6 million            Cuts in comparison with
             US Majors          1 million           December           2.7 million             forecast of Oil Demand De-
                                                                                               crease


                                                                                   Impiantistica Italiana - Maggio-Giugno 2020  19 19